Busbar joints, cable lugs, and breaker terminals inside electrical panels are exposed to continuous thermal stress during plant operation. Loose connections, contact resistance, aging joints, and load changes can gradually raise the temperature of a specific point. If this condition is not detected early, it can lead to unplanned downtime, power interruption, equipment damage, or fire risk.
Periodic thermal imaging is useful, but it is still a snapshot inspection method. It may miss abnormal temperature behavior that appears between inspection cycles or only under certain load conditions. A busbar wireless temperature monitoring system continuously captures temperature data from critical points so maintenance teams can detect trends, compare phases, and respond before a fault develops.
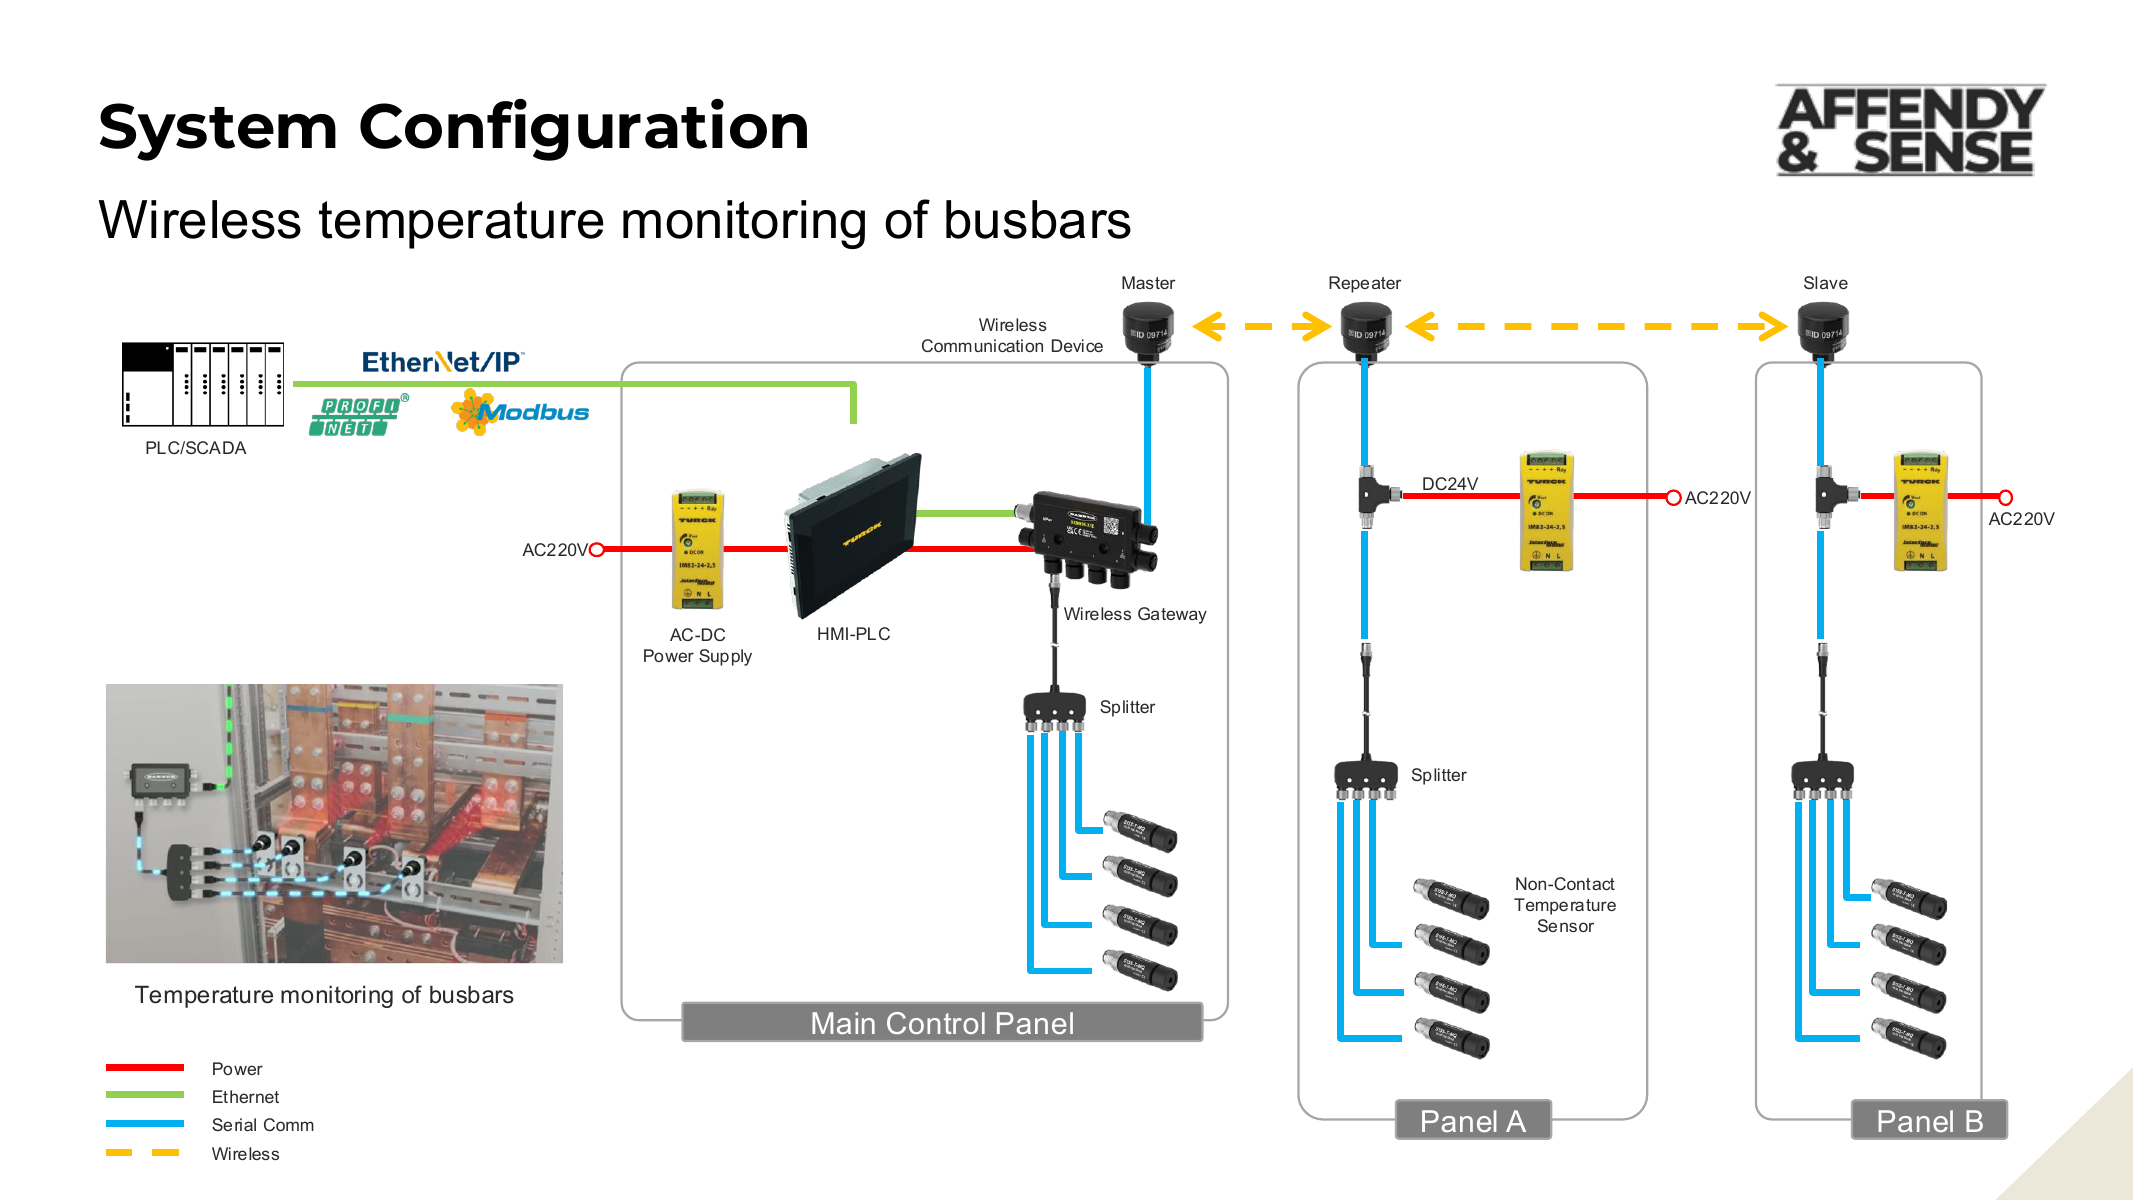
System Overview
The system monitors key busbar and terminal points using non-contact infrared temperature sensors. Sensor data is collected through a gateway and displayed on an HMI-PLC for local monitoring. Depending on the customer’s IT/OT policy, the same data can also be integrated with SCADA, a legacy system, or a cloud dashboard.
Typical system components include:
- Non-contact infrared temperature sensors
- M12 cables, splitters, and junction modules
- Wireless communication devices or wired Modbus segments
- Wireless gateway
- HMI-PLC Edge Controller
- 24VDC power supply and panel accessories
- Optional repeaters, antennas, enclosures, and network switches
The non-contact measurement approach allows the sensor to monitor the target surface without attaching directly to the energized conductor. However, measurement reliability depends on the installation geometry. Sensor distance, angle, field of view, target surface condition, reflection, and line of sight must be reviewed before final installation.
Recommended Monitoring Points
The first targets should be panels where failure would create a high operational impact. Typical PoC candidates include critical feeder panels, MCC panels, main distribution panels, and transformer secondary side panels.
Inside the panel, the monitoring points should normally focus on:
- R/S/T phase busbar joints
- Cable lug connection points
- Breaker terminals
- Points with previous thermal imaging abnormalities
- Power connections serving high-load or high-downtime-cost equipment
The goal is not simply to install as many sensors as possible. The better approach is to standardize the measurement points so phase-to-phase comparison is meaningful. If the R/S/T sensors are installed at different distances or angles, the comparison value may become less reliable.
HMI and Alarm Logic
The HMI-PLC acts as the local monitoring and alarm control device. Operators can view panel temperature, phase deviation, joint status, trend graphs, and alarm history directly at site.
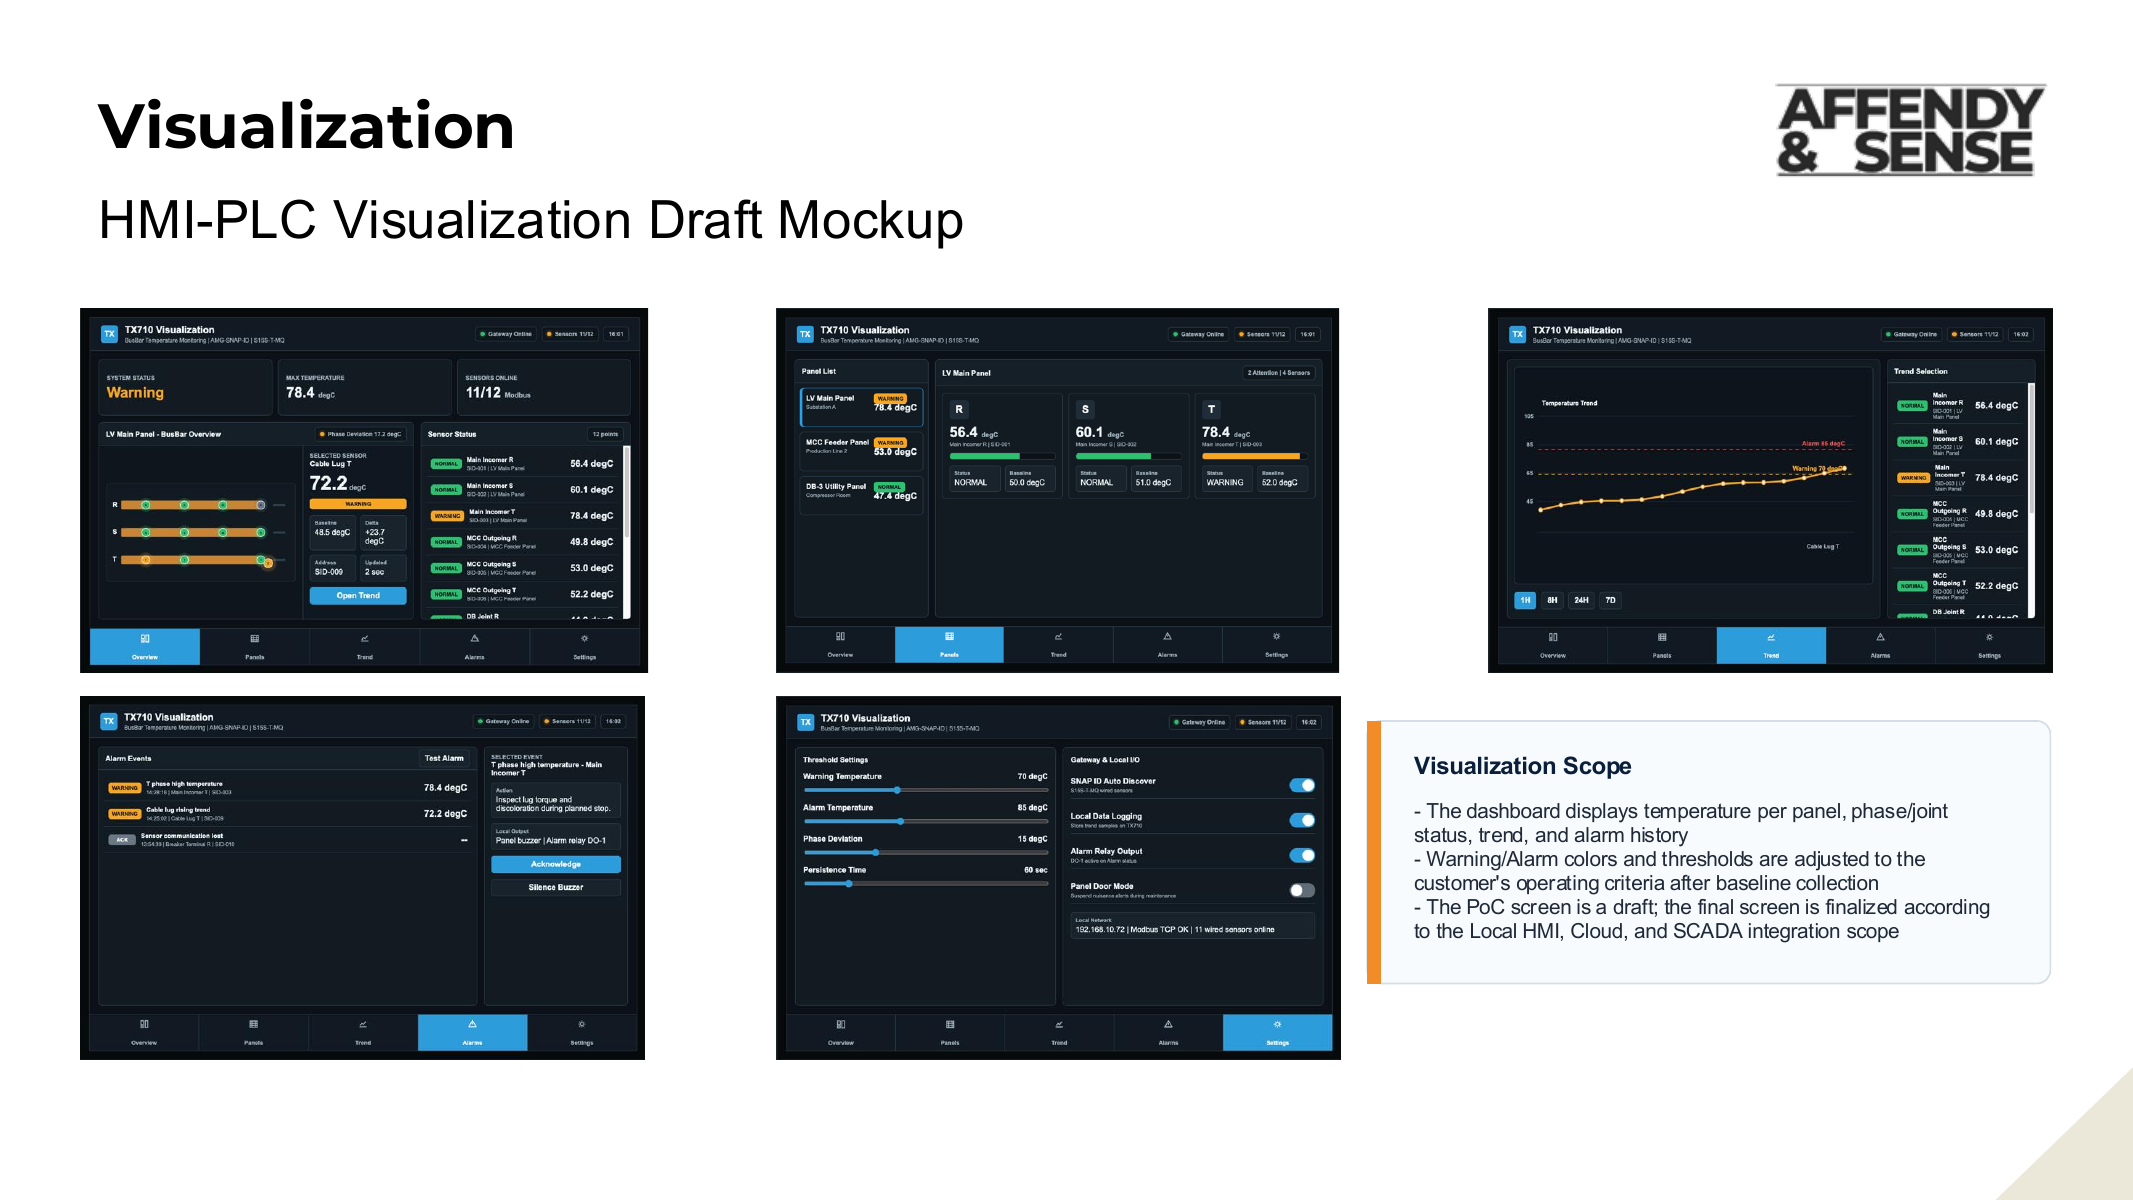
The visualization should make abnormal conditions easy to identify without opening multiple engineering screens. A practical dashboard can include an overview page, panel-by-panel temperature status, trend history, alarm events, and threshold settings. During the PoC stage, these screens are treated as a draft and adjusted after the customer confirms the final monitoring points, alarm policy, and integration scope.
Alarm logic should not rely only on a single absolute temperature threshold. In real operation, normal temperature can vary depending on load rate, ambient temperature, season, ventilation, and panel structure. For this reason, the PoC should first collect baseline data under normal operating conditions, then tune the Warning and Alarm thresholds based on actual site behavior.
Recommended alarm inputs include:
- Absolute temperature
- R/S/T phase deviation
- Rate of temperature rise
- Duration condition before alarm activation
- Repeated alarm suppression
This structure helps reduce nuisance alarms while still highlighting the joints that need inspection.
Wireless Site Survey
Wireless communication quality can vary significantly inside electrical rooms because metal panels, layout, distance, and installed equipment can affect signal performance. A site survey should be performed using the actual gateway and node positions before the final installation plan is fixed.
The survey should confirm:
- Gateway and node candidate locations
- Packet quality with the panel door condition considered
- Whether a repeater is required
- Antenna position and shielding effects
- Available installation space and power supply
- Restricted areas and work permit requirements
Locations with repeated packet loss or poor signal quality should be excluded from the standard installation plan, or improved through gateway relocation, repeater application, antenna adjustment, or panel grouping changes.
PoC Implementation Flow
The initial PoC should start with one or two critical panels. The purpose is to validate the sensor placement, communication quality, dashboard layout, and alarm policy before expanding to more panels.
A practical PoC flow is:
- Confirm target panels and priority.
- Review panel drawings, busbar structure, installation space, power supply, and network policy.
- Finalize sensor quantity, bracket type, cable length, and gateway configuration.
- Measure wireless packet quality at the actual candidate positions.
- Install sensors and configure Modbus/SNAP ID recognition and tag mapping.
- Build the HMI dashboard and alarm screens.
- Collect baseline temperature data under normal load conditions.
- Tune Warning and Alarm thresholds.
- Prepare the standard expansion configuration and budget proposal.
PoC deliverables should include the as-built sensor list, installation locations, baseline temperature trend, draft alarm thresholds, wireless survey results, and recommended expansion configuration.
Integration Options
Busbar temperature monitoring can be deployed in stages depending on customer requirements and IT/OT approval status.
Local Standalone
The HMI-PLC displays temperature, trend, alarm, and history locally. This is suitable for the first PoC or for sites where external network approval is not yet available.
SCADA / Legacy System
The system can exchange tags with upper-level systems through OPC UA or Modbus TCP. For this option, the tag list, protocol, polling interval, alarm acknowledgement flow, and system owner should be finalized in advance.
Cloud
A cloud option can provide a remote dashboard, email alerts, and trend export. This is useful for multi-site or multi-panel expansion, but it requires confirmation of firewall rules, network zones, account policy, data retention, and permitted remote access scope.
Customer Confirmation Items
The fastest way to start a PoC is to clarify the field conditions before finalizing the technical design.
Key confirmation items include:
- One or two PoC target panels
- Shutdown window or live-work policy
- Available installation space and sensor line of sight
- Available 24VDC or AC220V power
- Required mode: local only, SCADA/legacy integration, cloud, or hybrid
- IP range, VLAN, firewall, and account policy
- Previous thermal imaging data or abnormality history
- PoC success criteria and expansion budget approval method
Expected Value
A busbar wireless temperature monitoring system is more than a temperature display. It creates a data-based inspection layer for electrical assets by recording operating temperature, detecting phase deviation, and identifying rising trends that may not be visible during periodic inspections.
After the PoC confirms the baseline temperature profile and alarm policy, the same configuration can be expanded in phases to critical feeders, MCC panels, transformer secondary side panels, and main distribution panels. For plants where electrical downtime is expensive, a focused PoC is a practical first step toward a standardized condition monitoring program.